Moving up and down the pyramid
Every dataset on the hub is stored as a pyramid: the same field written out at a series of HEALPix levels, each one four times coarser than the last. Choosing a level is normally all you need to do, and the number in the URL is the whole of the API.
Sometimes you need to do it yourself, in memory, on a field you have already
computed or selected. Nested ordering makes that a reshape. The four
children of cell i at level k are cells 4i, 4i+1, 4i+2 and 4i+3
at level k+1, always, with no lookup table. Combine that with equal areas
and coarsening by one level is coarsen(cell=4).mean().
What the store says it did
The pyramid levels are not anonymous. grid-doctor records how each one was made, so the claim this example is about to check is written down in the file rather than assumed.
import cartopy.crs as ccrs
import matplotlib.pyplot as plt
import numpy as np
import xarray as xr
from healpix_geo import nested

S3 = {"anon": True, "endpoint_url": "https://s3.waterpark.dkrz.de"}
FINE = "s3://reanalysis/healpix/era5/P1M/level_5.zarr"
COARSE = "s3://reanalysis/healpix/era5/P1M/level_4.zarr"

fine = xr.open_zarr(FINE, storage_options=S3, chunks=None)
coarse = xr.open_zarr(COARSE, storage_options=S3, chunks=None)

for name, store in (("fine", fine), ("coarse", coarse)):
    print(f"{name:6s} level {store.attrs['healpix_level']}, "
          f"{store.sizes['cell']:6d} cells, "
          f"method {store.attrs.get('grid_doctor_method', 'unrecorded')}, "
          f"from level {store.attrs.get('grid_doctor_coarsened_from_level', '-')}")
month = "2021-07"
fine_map = fine["tas"].sel(time=month).squeeze().load()
coarse_map = coarse["tas"].sel(time=month).squeeze().load()
Coarsening by hand
One line, with one trap in front of it. Coordinates coarsen too, and the average of four longitudes is not the longitude of anything: four cells that straddle the dateline average to somewhere near Greenwich. Drop every coordinate before you coarsen and recompute them afterwards from the new cell indices, which costs nothing.
derived = fine_map.drop_vars(list(fine_map.coords)).coarsen(cell=4).mean()

cells = np.arange(derived.sizes["cell"], dtype="uint64")
lon, lat = nested.healpix_to_lonlat(cells, coarse.attrs["healpix_level"])
derived = derived.assign_coords(
    cell=("cell", cells.astype("int64")),
    longitude=("cell", np.asarray(lon)),
    latitude=("cell", np.asarray(lat)),
)

print(f"derived {derived.sizes['cell']} cells from {fine_map.sizes['cell']}")
Does it match what the pyramid stored?
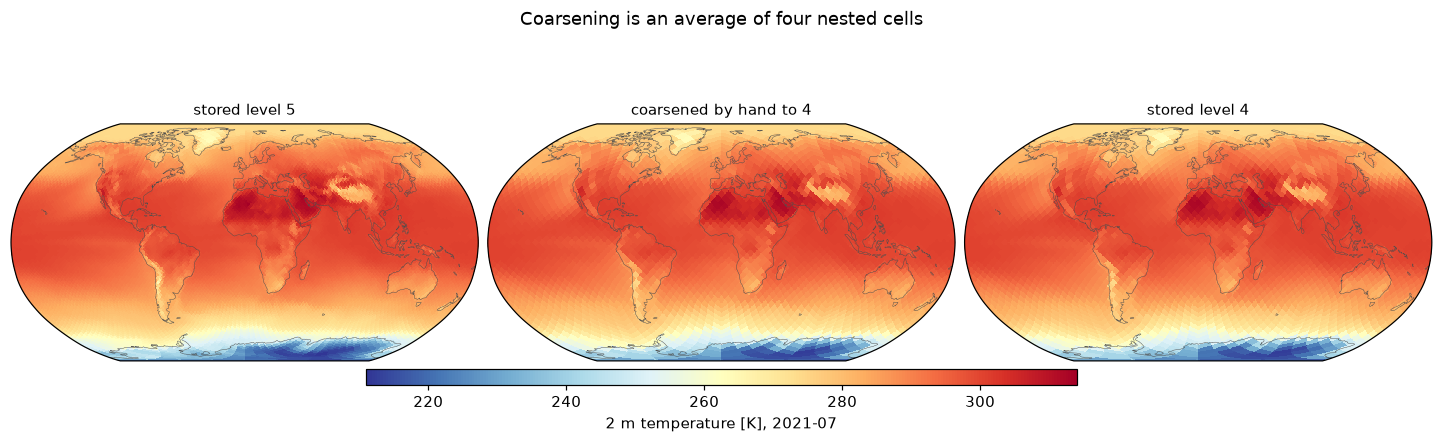
Conservative remapping on an equal-area grid is the plain mean of the four children, so the two should agree to floating point. Checking is cheap, and the check is worth keeping: it catches a pyramid built by subsampling, one written in ring ordering, and one whose levels came from different source data.
residual = derived.values - coarse_map.values

print(f"max |difference| {np.abs(residual).max():.3e} K")
print(f"rms  difference  {np.sqrt(np.mean(residual**2)):.3e} K")
print(f"field range      {float(coarse_map.min()):.1f} to {float(coarse_map.max()):.1f} K")
The plot
def rasterize(values, level, nlon=720, nlat=360):
    lon = np.linspace(-180, 180, nlon)
    lat = np.linspace(90, -90, nlat)
    mesh_lon, mesh_lat = np.meshgrid(lon, lat)
    cells = nested.lonlat_to_healpix(mesh_lon.ravel(), mesh_lat.ravel(), level)
    return np.asarray(values)[cells.astype("int64")].reshape(mesh_lat.shape), lon, lat


panels = [
    (f"stored level {fine.attrs['healpix_level']}", fine_map.values,
     fine.attrs["healpix_level"]),
    (f"coarsened by hand to {coarse.attrs['healpix_level']}", derived.values,
     coarse.attrs["healpix_level"]),
    (f"stored level {coarse.attrs['healpix_level']}", coarse_map.values,
     coarse.attrs["healpix_level"]),
]
vmin = float(min(v.min() for _, v, _ in panels))
vmax = float(max(v.max() for _, v, _ in panels))

fig = plt.figure(figsize=(13, 3.9), layout="constrained")
for index, (title, values, level) in enumerate(panels, start=1):
    raster, lon, lat = rasterize(values, level)
    ax = fig.add_subplot(1, 3, index, projection=ccrs.Robinson())
    ax.coastlines(linewidth=0.3, color="0.3")
    ax.set_global()
    mesh = ax.pcolormesh(lon, lat, raster, cmap="RdYlBu_r", vmin=vmin, vmax=vmax,
                         shading="auto", transform=ccrs.PlateCarree())
    ax.set_title(title, fontsize=10)

fig.colorbar(mesh, ax=fig.axes, orientation="horizontal", shrink=0.5,
             aspect=45, pad=0.02, label=f"2 m temperature [K], {month}")
fig.suptitle("Coarsening is an average of four nested cells", fontsize=12)

fig.savefig("07_pyramid_levels.png", dpi=110, bbox_inches="tight", facecolor="white")
Moving up and down the pyramid
Going the other way
Refining is the same identity read backwards, and it is
np.repeat(values, 4): every child inherits its parent's value. That is
nearest neighbour upsampling, not interpolation, and it is what you want
when you need a coarse field on a fine cell axis in order to subtract it
from something. It is not what you want if you need a smooth field, in
which case nested.bilinear_interpolation gives you weights.
The general shift is two bits per level: the level k parent of a level
n cell is cell >> (2 * (n - k)). That one expression is behind every
cross-level operation in the hub, including the region selection in the
regional data guide and the comparison in the
next example.
When the residual is not zero
Conservative coarsening of a linear quantity on an equal-area grid is exact. It is not exact for a quantity that was already an average over something else, for a masked field where some children are missing, or for anything computed non-linearly from the field, such as a maximum or a threshold exceedance. For those, coarsen the inputs and recompute rather than coarsening the answer.
Run it yourself: examples/07_pyramid_levels.py